FREE NHL Picks Today! | NHL Predictions | NHL Props | NHL Stanley Cup Playoffs | NHL Picks 4/25/24

Chris Meaney


The Baltimore Ravens finish the 2023 season on top of the FTN DVOA ratings, followed by the San Francisco 49ers. Both teams dropped a little in Week 18 as they sat many starters, but they still both rank among the top 10 teams ever ranked by DVOA. The Ravens were third before sitting starters and drop to fifth. The 49ers were sixth before sitting starters and drop to eighth.
| Best Regular-Season DVOA, 1981-2023 | |||||||||
| Year | Team | W-L | DVOA | Off | Rk | Def | Rk | ST | Rk |
| 2007 | NE | 16-0 | 52.3% | 37.6% | 1 | -11.0% | 4 | 3.6% | 7 |
| 1991 | WAS | 14-2 | 49.5% | 21.6% | 2 | -19.2% | 3 | 8.6% | 1 |
| 1985 | CHI | 15-1 | 45.8% | 12.8% | 5 | -29.2% | 1 | 3.8% | 5 |
| 2010 | NE | 14-2 | 45.7% | 38.2% | 1 | -2.7% | 14 | 4.7% | 8 |
| 2023 | BAL | 13-4 | 45.5% | 19.1% | 4 | -23.3% | 1 | 3.2% | 3 |
| 1987 | SF* | 10-2 | 41.5% | 19.6% | 3 | -20.6% | 1 | 1.3% | 9 |
| 1996 | GB | 13-3 | 39.7% | 11.0% | 4 | -21.1% | 1 | 7.6% | 2 |
| 2023 | SF | 12-5 | 39.4% | 31.8% | 1 | -9.6% | 4 | -2.0% | 25 |
| 1995 | SF | 11-5 | 39.0% | 16.7% | 4 | -24.5% | 1 | -2.2% | 22 |
| 2022 | BUF | 13-3 | 38.6% | 19.8% | 2 | -14.1% | 2 | 4.7% | 1 |
| 2019 | BAL | 14-2 | 38.5% | 23.8% | 1 | -13.3% | 4 | 1.5% | 9 |
| 1995 | DAL | 12-4 | 37.6% | 28.4% | 1 | -4.8% | 10 | 4.3% | 4 |
| 1999 | STL | 13-3 | 36.4% | 16.4% | 5 | -17.4% | 3 | 2.6% | 9 |
| *includes 12 non-strikebreaker games | |||||||||
One of the reasons that the Ravens finished so historically high in DVOA is that they are the first team to have more than two 100% games in a season. They ended up with four of them, victories over Detroit, Seattle, San Francisco, and Miami. Also, the Ravens are adjusted upwards for playing the fifth-toughest schedule of 2023.
Just as remarkable is that the Ravens will go into the playoffs with the second-highest season-ending weighted DVOA ever despite sitting their starters in Week 18. The 2010 Patriots had the highest weighted DVOA at the end of a regular season, 56.4%. The Ravens are currently at 52.2% but were at a record-setting 57.1% before sitting starters this week. Now, here’s the surprise, and the scary news for Ravens fans: the best teams in weighted DVOA have a habit of not winning the Super Bowl. Some of these teams weren’t No. 1 seeds, so they didn’t have home-field advantage or the bye week, but still, it’s a bit of a surprise how many of these teams fell short.
| Best Weighted DVOA, End Regular Season, 1981-2023 | |||
| Year | Team | W-L | WEI DVOA |
| 2010 | NE | 14-2 | 56.4% |
| 2023 | BAL | 13-4 | 52.2% |
| 2019 | BAL | 14-2 | 46.6% |
| 2015 | SEA | 10-6 | 45.9% |
| 1985 | CHI | 15-1 | 45.8% |
| 1987 | SF | 10-2 | 45.4% |
| 1991 | WAS | 14-2 | 45.3% |
| 2019 | NO | 13-3 | 44.3% |
| 2023 | SF | 12-5 | 43.8% |
| 2012 | SEA | 11-5 | 43.6% |
| 2007 | NE | 16-0 | 43.0% |
| 2012 | DEN | 13-3 | 40.6% |
| 2012 | NE | 12-4 | 39.3% |
| 1989 | SF | 14-2 | 38.9% |
But wait, there’s more. The Ravens finished in the top four in all three phases of the game. They dropped to fourth in offense because of Tyler Huntley playing in a rainstorm, but ranked first in defense and third in special teams. The Ravens are only the sixth team to finish in the top five in all three phases in the new version of DVOA that I introduced before this season. Four of the previous five teams won the Super Bowl. Last year’s Bills were the other.
| Top 5 DVOA in All Three Phases, 1981-2023 | |||||||||
| Year | Team | W-L | DVOA | Off | Rk | Def | Rk | ST | Rk |
| 1985 | CHI | 15-1 | 45.8% | 12.8% | 5 | -29.2% | 1 | 3.8% | 5 |
| 1991 | WAS | 14-2 | 49.5% | 21.6% | 2 | -19.2% | 3 | 8.6% | 1 |
| 1996 | GB | 13-3 | 39.7% | 11.0% | 4 | -21.1% | 1 | 7.6% | 2 |
| 1997 | DEN | 12-4 | 32.4% | 18.0% | 2 | -10.0% | 5 | 4.3% | 4 |
| 2022 | BUF | 13-3 | 38.6% | 19.8% | 2 | -14.1% | 2 | 4.7% | 1 |
| 2023 | BAL | 13-4 | 45.5% | 19.1% | 4 | -23.3% | 1 | 3.2% | 3 |
San Francisco had the more common accomplishment of finishing in the top five in both offense and defense, no matter the rating for special teams. This was accomplished by 42 teams between 1981 and 2022, or one per year on average. If we’re looking for teams that managed to rank in the top four in both offense and defense, like Baltimore and San Francisco, that drops to 23 teams.
The 49ers’ offense still ranks among the top 10 offenses ever tracked by DVOA despite starting Sam Darnold in the final week.
| Best Offensive DVOA, 1981-2023 | |||
| Year | Team | W-L | DVOA |
| 2010 | NE | 14-2 | 38.2% |
| 1982 | SD | 6-3 | 38.1% |
| 2007 | NE | 16-0 | 37.6% |
| 2018 | KC | 12-4 | 33.1% |
| 2002 | KC | 8-8 | 32.9% |
| 1984 | MIA | 14-2 | 32.2% |
| 2004 | IND | 12-4 | 32.1% |
| 1998 | DEN | 14-2 | 32.1% |
| 2023 | SF | 12-5 | 31.8% |
| 1992 | SF | 14-2 | 31.7% |
| 1993 | SF | 10-6 | 30.8% |
| 2004 | KC | 7-9 | 30.7% |
That’s a lot of tables, and there were some teams playing this year besides the Ravens and 49ers. The Buffalo Bills end the year at No. 3 after being on top a year ago. Dallas and Kansas City round out the top five. There was a lot of year-to-year consistency between 2022 and 2023. The top 11 teams of 2023 all ranked 13th or higher in 2022. The consistency was primarily due to consistency on offense. Compare 2023 to 2022, which was a year that was particularly different from the previous year of 2021.
From 2022 to 2023, the year-to-year correlation of overall DVOA was .66. It was .51 for offense, .26 for defense, and .28 for special teams.
From 2021 to 2022, the year-to-year correlation of overall DVOA was .37. It was .27 for offense, .33 for defense, and .23 for special teams.
There were a couple of teams with big changes between 2022 and 2023:
The top teams this year generally had the top offenses. As noted above, the 49ers had one of the best offenses in DVOA history. There was a big gap after the 49ers, and then Baltimore, Miami, and Buffalo were packed tightly. Then there was another big gap with Detroit ranked fifth.
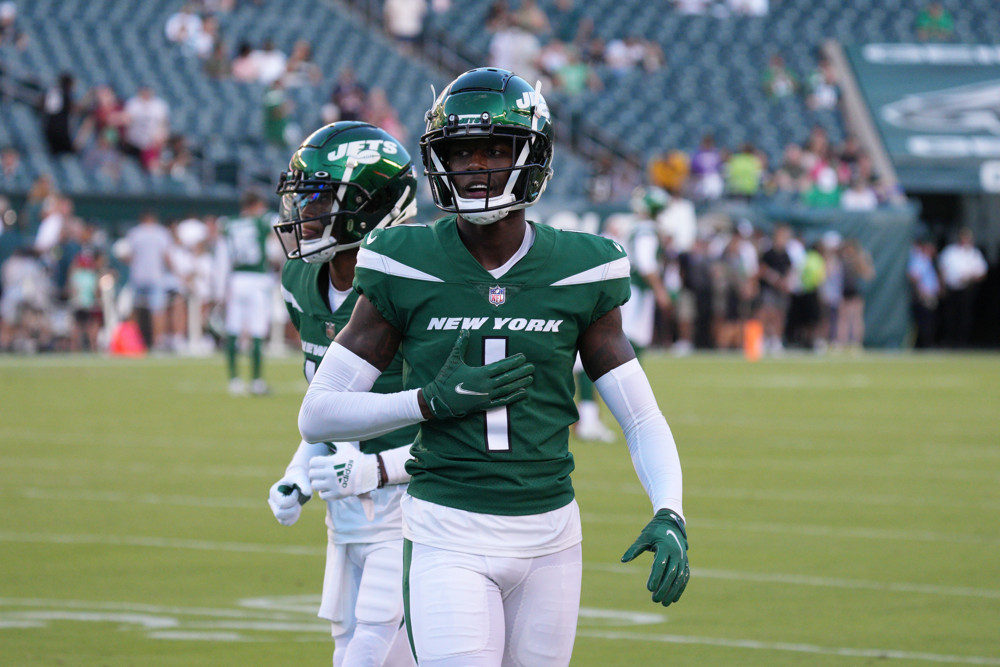
The worst offense of this season belonged to the New York Jets. That’s not how it was supposed to work when they traded for Aaron Rodgers! Carolina and the New York Giants were second and third from the bottom, respectively.
Baltimore stayed ahead of Cleveland to finish as the top defense. The Ravens and Browns finish as the 12th-best and 18th-best defenses in DVOA history, respectively. There’s a gap in the ratings and then the New York Jets were third on defense with San Francisco fourth and Dallas fifth.
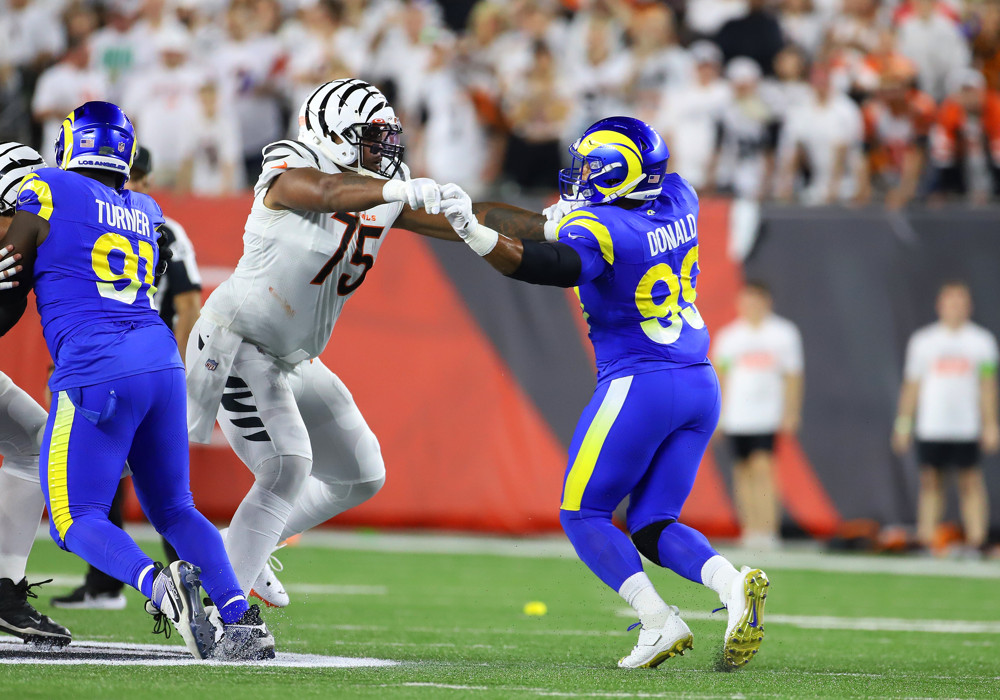
The Philadelphia Eagles led the league in special teams DVOA at 4.2%. This is the second-lowest rating ever for a team that finished No. 1; only the 1992 Lions finished No. 1 with a lower rating. The special teams ratings are very tightly packed except for the Rams being way, way behind in last place, as noted above.
The Cincinnati Bengals played the toughest schedule in the league this season and finish with the ninth-toughest schedule in DVOA history. (It ranked higher after Week 17, but some of their past opponents had weak games in Week 18, in particular the Browns sitting their starters.) Four of the five hardest schedules belonged to the AFC North, which makes sense because every team in that division had a winning record. Arizona had the hardest schedule in the NFC.
New Orleans played the easiest schedule in the league and finished with the No. 11 toughest schedule in DVOA history. Atlanta, Dallas, Chicago, and Green Bay make up the list of the five teams with the easiest schedules. Houston had the easiest schedule in the AFC.
Finally, I wrote a couple weeks ago about how the Giants were on pace to break the record for the worst offensive adjusted sack rate. Tyrod Taylor turned out to be more sack-avoidant than Daniel Jones or Tommy DeVito, and therefore the Giants did not set the record. Their ending ASR of 14.4% ranks second behind the 2002 Texans at 15.0%.
* * * * *
We’ll review the best and worst player stats of the year in a special Quick Reads later this week.
Please note that while this article is called “Final 2023 DVOA Ratings,” we will continue with postseason weighted DVOA ratings each Monday through the playoffs. There also may be small changes in the final 2023 DVOA ratings based on postseason changes to the play-by-play.
* * * * *
These are the FTN DVOA ratings through the entire 2023 regular season. Our Defense-adjusted Value Over Average (DVOA) system breaks down every single play and compares a team’s performance to the league average based on situation in order to determine value over average. (Explained further here.)
OFFENSE and DEFENSE DVOA are adjusted for performance indoors and consider all fumbles, kept or lost, as equal value. SPECIAL TEAMS DVOA is adjusted for type of stadium (warm, cold, dome, Denver) and week of season. As always, positive numbers represent more points so DEFENSE is better when it is NEGATIVE.
WEIGHTED DVOA gives more weight to recent games and less weight to early-season games to get a better idea of how teams are playing now. Unlike the ratings in our playoff odds report, these ratings are not adjusted to reflect teams sitting starters in Week 18.
LAST YEAR represents final 2022 rank.
| RK | TEAM | TOTAL DVOA |
LAST YEAR |
WEI. DVOA |
RK | W-L | OFF. DVOA |
OFF. RK |
DEF. DVOA |
DEF. RK |
S.T. DVOA |
S.T. RK |
| 1 | BAL | 45.5% | 5 | 52.2% | 1 | 13-4 | 19.1% | 4 | -23.3% | 1 | 3.2% | 3 |
| 2 | SF | 39.4% | 3 | 38.4% | 2 | 12-5 | 31.8% | 1 | -9.6% | 4 | -2.0% | 25 |
| 3 | BUF | 24.1% | 1 | 21.6% | 3 | 11-6 | 20.1% | 3 | -3.4% | 12 | 0.6% | 15 |
| 4 | DAL | 19.1% | 7 | 21.0% | 4 | 12-5 | 8.8% | 9 | -8.7% | 5 | 1.6% | 10 |
| 5 | KC | 17.9% | 4 | 12.7% | 6 | 11-6 | 10.0% | 8 | -5.0% | 7 | 2.9% | 6 |
| 6 | MIA | 17.6% | 8 | 16.9% | 5 | 11-6 | 20.9% | 2 | 2.4% | 19 | -0.9% | 22 |
| 7 | DET | 17.0% | 9 | 12.0% | 7 | 12-5 | 13.8% | 5 | -3.2% | 13 | 0.0% | 19 |
| 8 | CLE | 8.8% | 10 | 4.1% | 13 | 11-6 | -12.3% | 28 | -20.7% | 2 | 0.3% | 16 |
| 9 | PIT | 7.8% | 13 | 8.8% | 8 | 10-7 | 0.3% | 15 | -8.0% | 6 | -0.4% | 20 |
| 10 | JAX | 4.4% | 12 | 1.2% | 17 | 9-8 | -1.3% | 18 | -4.2% | 10 | 1.4% | 12 |
| 11 | CIN | 4.3% | 6 | 8.3% | 9 | 9-8 | 6.7% | 11 | 5.5% | 23 | 3.1% | 4 |
| 12 | HOU | 3.1% | 31 | 0.9% | 18 | 10-7 | 1.0% | 14 | 0.0% | 16 | 2.2% | 7 |
| 13 | GB | 1.6% | 15 | 5.3% | 12 | 9-8 | 13.0% | 6 | 8.2% | 27 | -3.2% | 31 |
| 14 | PHI | 1.1% | 2 | -6.6% | 21 | 11-6 | 8.3% | 10 | 11.4% | 29 | 4.2% | 1 |
| 15 | NO | 1.0% | 18 | 3.3% | 14 | 9-8 | -0.6% | 17 | -0.8% | 15 | 0.8% | 14 |
| 16 | SEA | -0.1% | 11 | -2.7% | 19 | 9-8 | 6.2% | 12 | 8.2% | 28 | 1.9% | 8 |
| RK | TEAM | TOTAL DVOA |
LAST YEAR |
WEI. DVOA |
RK | W-L | OFF. DVOA |
OFF. RK |
DEF. DVOA |
DEF. RK |
S.T. DVOA |
S.T. RK |
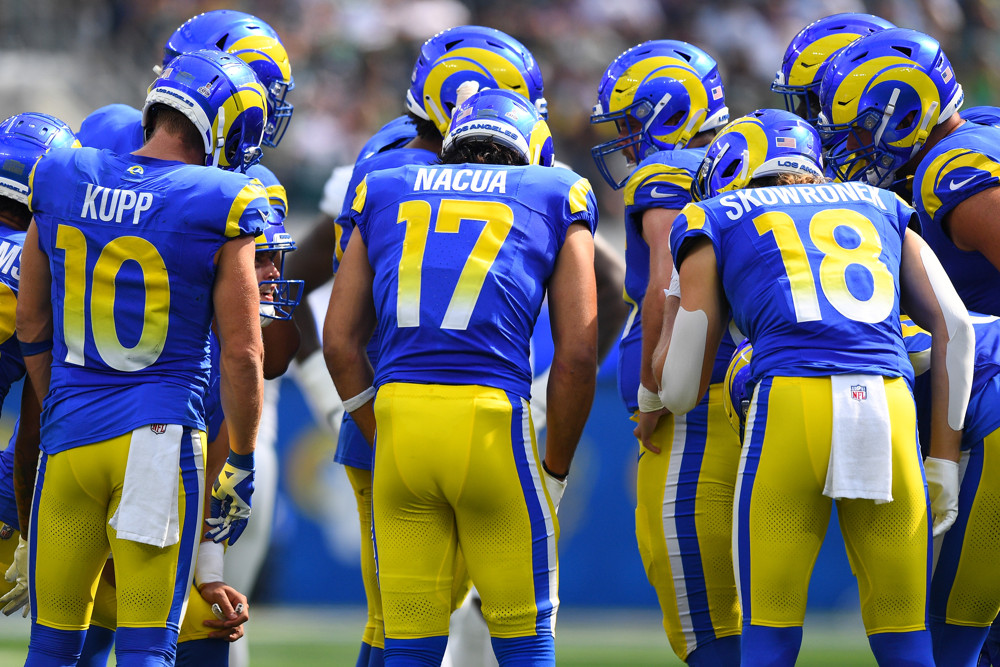
| 17 | LAR | -0.3% | 27 | 1.8% | 16 | 10-7 | 12.2% | 7 | 3.4% | 22 | -9.2% | 32 |
| 18 | TB | -1.2% | 14 | 1.8% | 15 | 9-8 | -3.6% | 20 | -2.4% | 14 | 0.0% | 18 |
| 19 | LAC | -3.2% | 17 | -8.4% | 23 | 5-12 | 0.1% | 16 | 7.5% | 26 | 4.1% | 2 |
| 20 | IND | -3.8% | 32 | -7.4% | 22 | 9-8 | 1.9% | 13 | 2.6% | 20 | -3.1% | 29 |
| 21 | LV | -5.3% | 21 | 7.4% | 10 | 8-9 | -10.7% | 27 | -4.6% | 8 | 0.9% | 13 |
| 22 | CHI | -7.1% | 30 | 6.7% | 11 | 7-10 | -6.5% | 22 | 0.8% | 17 | 0.2% | 17 |
| 23 | MIN | -7.2% | 28 | -10.5% | 25 | 7-10 | -7.9% | 23 | -3.9% | 11 | -3.2% | 30 |
| 24 | DEN | -11.9% | 26 | -4.5% | 20 | 8-9 | -1.6% | 19 | 12.1% | 30 | 1.8% | 9 |
| 25 | NYJ | -12.5% | 20 | -10.4% | 24 | 7-10 | -29.8% | 32 | -14.2% | 3 | 3.1% | 5 |
| 26 | TEN | -13.4% | 24 | -13.5% | 26 | 6-11 | -10.1% | 25 | 1.4% | 18 | -1.9% | 24 |
| 27 | NE | -15.8% | 16 | -17.8% | 29 | 4-13 | -17.2% | 29 | -4.5% | 9 | -3.1% | 28 |
| 28 | ATL | -18.6% | 19 | -15.2% | 28 | 7-10 | -9.8% | 24 | 5.8% | 24 | -2.9% | 27 |
| 29 | ARI | -20.4% | 29 | -22.2% | 30 | 4-13 | -4.5% | 21 | 17.3% | 32 | 1.5% | 11 |
| 30 | NYG | -26.6% | 23 | -15.2% | 27 | 6-11 | -23.0% | 30 | 3.0% | 21 | -0.6% | 21 |
| 31 | WAS | -28.5% | 22 | -34.1% | 31 | 4-13 | -10.4% | 26 | 16.0% | 31 | -2.1% | 26 |
| 32 | CAR | -35.3% | 25 | -34.7% | 32 | 2-15 | -27.5% | 31 | 6.5% | 25 | -1.2% | 23 |