It’s getting tight at the top of our DVOA ratings after 12 weeks of the 2023 NFL season. At the same time, it’s not tight at all. That’s because we have two teams nearly tied and then a huge gap between those two teams and the rest of the NFL.
The Baltimore Ravens remain No. 1 in DVOA this week despite their rating dropping a couple of percentage points from where it was a week ago. Zay Flowers‘ 37-yard touchdown on a jet sweep at the end of Baltimore’s victory over the Chargers is the difference between the Ravens and the No. 2 San Francisco 49ers; without that play, the Ravens would be in second place. The 49ers have the best offense in the NFL this year. Overall, they move up slightly to the edge of 40%. San Francisco would be first without opponent adjustments.
Then there’s a huge gap of over 12 percentage points before we get to the rest of the league. Kansas City is a healthy third in DVOA. The Dallas Cowboys move up to fourth with a blowout of the Washington Commanders on Thanksgiving. The Buffalo Bills drop a little bit after their close loss to Philadelphia but remain in fifth place. Miami is up a spot to sixth, Detroit down three spots to seventh. Philadelphia and their 10-1 record are still only ninth in DVOA, very slightly (.013%) behind Jacksonville. Pittsburgh surprisingly moves up into 10th place, kicking the Cleveland Browns out of the top 10.
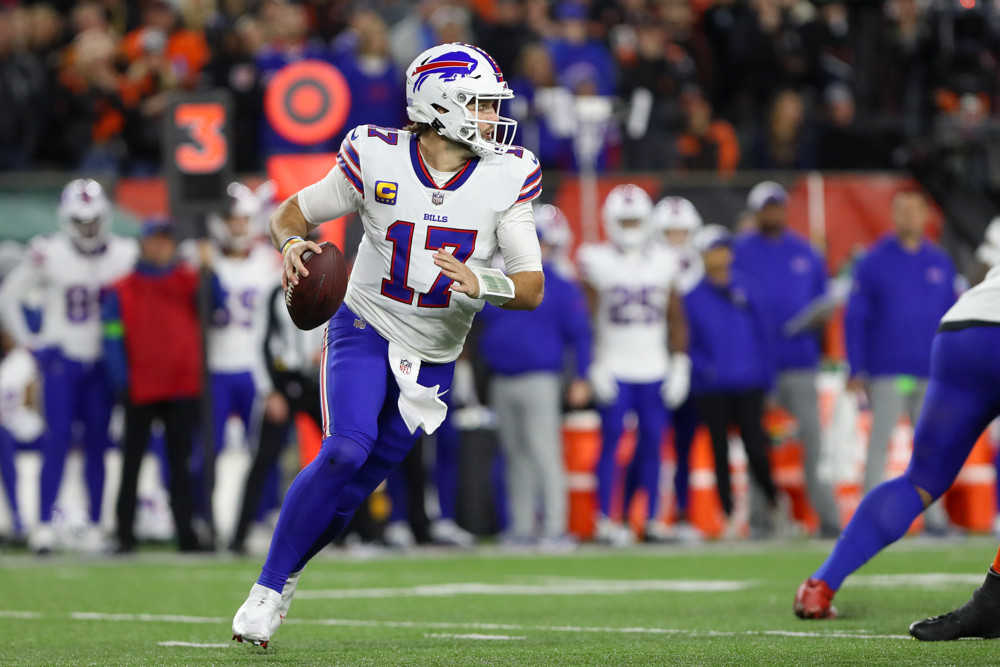
I’m not going to write in depth about the Philadelphia Eagles this week, because I already wrote about them last week. (Same thing with the Pittsburgh Steelers, also covered in depth in last week’s commentary.) I will note that while some EPA-based analysis around the Internet felt came out with a result that the Eagles won on Sunday despite being outplayed by the Bills, DVOA did not have this result. The Eagles had a single-game DVOA of 28% compared to 0% for the Bills. In our Post-Game Win Expectancy formula (explained here), the Eagles come out with an 86% chance to win given the statistical splits of this game. Two of the big reasons why: that last overtime drive and all those Bills penalties throughout the game. The Bills were dominating that game for the first two-and-a-half quarters, but the Eagles really came back in the fourth quarter and overtime.
Despite moving up after this game, the Eagles still make a list of the “worst” 10-1 teams in DVOA history. They’re far ahead of the two teams below them. The Bills also appear on the list of the best 6-6 teams along with a team that Bills fans absolutely do not want to hear about, the 2004 Bills, also known as the best team by DVOA to ever miss the playoffs. (These DVOA ratings and ranks are slightly different than those below because the tweets came out before Monday Night Football.)
Lower down on the DVOA table, we’re starting to see some gaps between total DVOA and weighted DVOA for teams that have improved or declined over the course of the year. For example, the Denver Broncos are 22nd in DVOA but 18th in weighted DVOA. Believe it or not, the Broncos defense is still dead last in defense because of Weeks 1-5. Terrible games for Washington and Arizona this week still couldn’t kick the Broncos out of last place. That’s not the case with weighted defense, where the Broncos are now 30th and climbing.
Records of the Ravens Run Game
How have the Baltimore Ravens built the top team in the league by DVOA? Strangely, it does not involve special teams, where the Ravens are just average this year. Instead, the secret is defense and running the ball. The Ravens are first in pass defense and sixth in run defense. They are only 14th in pass offense (including scrambles) but rank first in run offense with one of the best running games ever tracked by DVOA since 1981. This despite losing their starting running back, J.K. Dobbins, in Week 1! The Ravens running game is Lamar Jackson on quarterback keepers along with a committee of Gus Edwards, Justice Hill, and undrafted rookie Keaton Mitchell.
This is where I usually would run a table of the best running games by DVOA through X number of games, 12 in the case of the Ravens. However, a list of the best running games is not necessarily a list of the best running games compared to the average of each year. Let me explain what I mean.
As you probably know, each year of DVOA is normalized so that the league average is 0% on both offense and defense. That’s how we are able to properly compare teams such as the 1984 Dolphins to the offenses of the more high-flying modern era. However, run offense and pass offense are not normalized so league average is 0%. The league average of all offensive plays is 0%, which includes runs, passes, scrambles, the new separate category for aborted plays, and the dead-ball penalties that are counted in offensive DVOA. Because passing is almost always more efficient than rushing, the average DVOA for passing is going to be higher than the average DVOA for rushing. And the relationship between those two stats will change each year as sometimes the passing game is a little better and sometimes it is a little worse, and sometimes the running game is a little better and sometimes it is a little worse.
So a better way to look at the top running games in DVOA history may be to look at the difference between run DVOA and the average run DVOA for that season. This year, the average run DVOA is -5.7%. In seasons such as 2000 and 2002, the average team was better at running the ball. In seasons such as 2017 and 2018, the average team was worse at running the ball.
Here’s a look at the top 15 running games through 12 games, adjusted for the NFL average for run offense in each specific season. The top three teams remain the same: the 1999 Redskins with Stephen Davis, the 1998 Broncos with Terrell Davis, and this year’s Ravens. But there’s some movement below that.
| Top Running Games (Adjusted for NFL Average) Thru 12 Games, 1981-2023 |
|||||||
| Year | Team | W-L | Run Off | Rk | Year Avg | Adj Run Off | Rk |
| 1999 | WAS | 7-5 | 27.6% | 1 | -5.7% | 33.3% | 1 |
| 1998 | DEN | 12-0 | 27.2% | 2 | -4.5% | 31.7% | 2 |
| 2023 | BAL | 9-3 | 25.9% | 3 | -5.6% | 31.5% | 3 |
| 1995 | DAL | 10-2 | 24.6% | 5 | -5.2% | 29.8% | 4 |
| 2000 | STL | 8-4 | 24.9% | 4 | -3.8% | 28.7% | 5 |
| 2010 | NE | 10-2 | 21.5% | 9 | -6.7% | 28.2% | 6 |
| 2014 | SEA | 8-4 | 19.0% | 19 | -9.2% | 28.2% | 7 |
| 2002 | KC | 6-6 | 24.4% | 6 | -3.2% | 27.6% | 8 |
| 2017 | NO | 9-3 | 16.5% | 34 | -10.4% | 26.9% | 9 |
| 2005 | SD | 8-4 | 22.9% | 7 | -3.5% | 26.4% | 10 |
| 2010 | HOU | 5-7 | 19.1% | 18 | -6.7% | 25.8% | 11 |
| 2001 | SF | 9-3 | 20.2% | 13 | -5.5% | 25.7% | 12 |
| 1991 | MIN | 6-6 | 18.9% | 23 | -6.8% | 25.6% | 13 |
| 2004 | KC | 4-8 | 22.1% | 8 | -3.2% | 25.3% | 14 |
| 2018 | LAR | 11-1 | 15.3% | 41 | -9.6% | 25.0% | 15 |
When we adjust based on the league average running game, we get offenses such as the 2017 Saints (Alvin Kamara‘s rookie year) and the 2018 Rams (Todd Gurley). Mid-2000s offenses such as the 2004 Jets and 2005 Broncos, when the running game was generally more successful compared to five and six years ago, drop out of the top dozen. Most of these offenses should be familiar even to younger readers. You’ve got Emmitt Smith, Priest Holmes, LaDainian Tomlinson, Arian Foster at his peak, etc. The offense you may not recognize is the 1991 Vikings. That one had Rich Gannon at quarterback and a running committee of Herschel Walker and Terry Allen. Thirty-two-year-old Darrin Nelson also had 28 carries for 210 yards and two touchdowns.
A similar table for pass offense is not going to have as much movement up and down because the league average for pass offense is a bit more stable and the difference between teams at the top is larger. In fact, the same 15 teams that are the top passing games in pass offense DVOA are also the top passing games once we adjust for each season’s league average. This table is based on numbers through 11 games instead of 12 games so we can highlight the San Francisco 49ers instead of the Ravens.
| Top Passing Games (Adjusted for NFL Average) Thru 11 Games, 1981-2023 |
|||||||
| Year | Team | W-L | Pass Off | Rk | Year Avg | Adj Pass Off | Rk |
| 2007 | NE | 11-0 | 79.1% | 1 | 14.8% | 64.3% | 1 |
| 2004 | IND | 8-3 | 78.2% | 2 | 15.7% | 62.5% | 2 |
| 2018 | KC | 9-2 | 74.9% | 3 | 14.6% | 60.3% | 3 |
| 1993 | SF | 8-3 | 65.8% | 5 | 11.8% | 54.0% | 4 |
| 2023 | SF | 8-3 | 66.6% | 4 | 13.0% | 53.6% | 5 |
| 1984 | MIA | 11-0 | 65.3% | 7 | 12.5% | 52.8% | 6 |
| 1988 | CIN | 8-3 | 60.5% | 13 | 10.1% | 50.4% | 7 |
| 1998 | DEN | 11-0 | 65.6% | 6 | 16.6% | 49.1% | 8 |
| 1995 | CHI | 6-5 | 61.1% | 8 | 13.4% | 47.7% | 9 |
| 2011 | GB | 11-0 | 60.9% | 11 | 13.6% | 47.3% | 10 |
| 2012 | NE | 8-3 | 60.7% | 12 | 13.9% | 46.9% | 11 |
| 1995 | DAL | 9-2 | 60.2% | 14 | 13.4% | 46.8% | 12 |
| 1989 | SF | 9-2 | 59.1% | 15 | 12.5% | 46.6% | 13 |
| 2007 | DAL | 10-1 | 61.1% | 10 | 14.8% | 46.2% | 14 |
| 1991 | WAS | 11-0 | 61.1% | 9 | 15.7% | 45.4% | 15 |
Adjusting for the average pass offense in a given year mostly moves up Boomer Esiason and the 1988 Cincinnati Bengals and moves down the 1998 Broncos. Again, you’ll recognize the quarterbacks of most of these teams. But yes indeed, that does say the 1995 Bears, also known as the one year Erik Kramer went kind of nuts. Troy Aikman led all quarterbacks in passing DVOA that season, but he missed a couple of games which moved the Cowboys below the Bears as a team. Kramer also faltered a bit at the end of the season, as the Bears only had 14.8% passing DVOA from Week 13 to Week 17.
* * * * *
These are the FTN DVOA and DAVE ratings through 12 weeks of 2023. Our Defense-adjusted Value Over Average (DVOA) system breaks down every single play and compares a team’s performance to the league average based on situation in order to determine value over average. (Explained further here.)
OFFENSE and DEFENSE DVOA are adjusted for performance indoors and consider all fumbles, kept or lost, as equal value. SPECIAL TEAMS DVOA is adjusted for type of stadium (warm, cold, dome, Denver) and week of season. As always, positive numbers represent more points so DEFENSE is better when it is NEGATIVE.
DAVE is a formula which combines our preseason forecast with weighted DVOA (giving slightly more weight to recent games) to get a more accurate projection of how a team will play the rest of the season. DAVE is currently 7% preseason forecast and 93% actual performance for teams with 12 games and 16% forecast with 84% actual performance for teams with 11 games.
This is the last week we’ll run DAVE numbers as part of the weekly commentary. Starting next week, I’ll run weighted DVOA in that space instead.
| RK | TEAM | TOTAL DVOA |
LAST WEEK |
TOTAL DAVE |
RK | W-L | OFF. DVOA |
OFF. RANK |
DEF. DVOA |
DEF. RANK |
S.T. DVOA |
S.T. RANK |
| 1 | BAL | 40.7% | 1 | 39.8% | 1 | 9-3 | 17.3% | 4 | -23.3% | 2 | 0.1% | 19 |
| 2 | SF | 39.7% | 2 | 34.6% | 2 | 8-3 | 32.3% | 1 | -9.6% | 6 | -2.2% | 27 |
| 3 | KC | 27.3% | 3 | 24.9% | 3 | 8-3 | 15.9% | 5 | -9.3% | 8 | 2.2% | 8 |
| 4 | DAL | 23.1% | 6 | 24.8% | 4 | 8-3 | 9.1% | 10 | -12.2% | 3 | 1.9% | 9 |
| 5 | BUF | 20.6% | 5 | 16.5% | 6 | 6-6 | 22.3% | 2 | 0.8% | 14 | -0.9% | 21 |
| 6 | MIA | 19.4% | 7 | 17.2% | 5 | 8-3 | 21.9% | 3 | 1.2% | 15 | -1.2% | 24 |
| 7 | DET | 18.0% | 4 | 13.6% | 10 | 8-3 | 15.5% | 6 | -1.9% | 10 | 0.7% | 14 |
| 8 | JAX | 15.6% | 9 | 14.3% | 9 | 8-3 | 1.4% | 17 | -11.1% | 5 | 3.0% | 3 |
| 9 | PHI | 15.6% | 10 | 14.4% | 8 | 10-1 | 13.4% | 7 | 1.3% | 17 | 3.5% | 1 |
| 10 | PIT | 12.8% | 11 | 15.2% | 7 | 7-4 | 3.1% | 13 | -9.5% | 7 | 0.1% | 18 |
| 11 | CLE | 8.9% | 8 | 5.9% | 11 | 7-4 | -15.8% | 28 | -23.5% | 1 | 1.2% | 12 |
| 12 | HOU | 6.5% | 12 | 1.5% | 13 | 6-5 | 9.9% | 9 | 3.1% | 20 | -0.4% | 20 |
| 13 | LAC | 4.8% | 14 | 5.6% | 12 | 4-7 | 11.2% | 8 | 9.5% | 28 | 3.1% | 2 |
| 14 | IND | 3.0% | 17 | -0.6% | 16 | 6-5 | 2.1% | 15 | -1.9% | 11 | -1.0% | 22 |
| 15 | MIN | 1.4% | 13 | 0.7% | 15 | 6-6 | -2.5% | 19 | -7.3% | 9 | -3.5% | 29 |
| 16 | CIN | -1.5% | 15 | 1.1% | 14 | 5-6 | 2.8% | 14 | 7.0% | 26 | 2.8% | 5 |
| RK | TEAM | TOTAL DVOA |
LAST WEEK |
TOTAL DAVE |
RK | W-L | OFF. DVOA |
OFF. RANK |
DEF. DVOA |
DEF. RANK |
S.T. DVOA |
S.T. RANK |
| 17 | SEA | -2.1% | 16 | -3.2% | 20 | 6-5 | -1.3% | 18 | 3.1% | 22 | 2.3% | 7 |
| 18 | NO | -3.4% | 18 | -3.1% | 19 | 5-6 | -3.9% | 20 | 0.4% | 13 | 0.9% | 13 |
| 19 | GB | -4.0% | 21 | -1.6% | 17 | 5-6 | 1.7% | 16 | 1.9% | 18 | -3.8% | 30 |
| 20 | LAR | -5.0% | 20 | -7.5% | 21 | 5-6 | 5.2% | 11 | 3.1% | 21 | -7.1% | 32 |
| 21 | TB | -8.3% | 19 | -10.0% | 23 | 4-7 | -5.9% | 22 | 1.3% | 16 | -1.1% | 23 |
| 22 | DEN | -8.6% | 25 | -2.5% | 18 | 6-5 | 5.2% | 12 | 16.6% | 32 | 2.8% | 4 |
| 23 | TEN | -9.9% | 22 | -9.4% | 22 | 4-7 | -7.8% | 24 | 3.9% | 24 | 1.8% | 10 |
| 24 | CHI | -14.7% | 26 | -11.8% | 24 | 4-8 | -9.8% | 25 | 2.9% | 19 | -2.0% | 26 |
| 25 | NE | -17.7% | 24 | -15.8% | 27 | 2-9 | -13.2% | 27 | 0.1% | 12 | -4.4% | 31 |
| 26 | ATL | -18.0% | 29 | -14.5% | 25 | 5-6 | -7.3% | 23 | 8.3% | 27 | -2.3% | 28 |
| 27 | NYJ | -18.0% | 23 | -17.7% | 28 | 4-7 | -31.8% | 32 | -12.0% | 4 | 1.8% | 11 |
| 28 | LV | -18.8% | 28 | -15.8% | 26 | 5-7 | -15.9% | 29 | 3.5% | 23 | 0.6% | 15 |
| 29 | WAS | -20.9% | 27 | -19.6% | 29 | 4-8 | -5.6% | 21 | 15.6% | 31 | 0.2% | 16 |
| 30 | ARI | -26.6% | 30 | -28.0% | 30 | 2-10 | -12.1% | 26 | 14.8% | 30 | 0.2% | 17 |
| 31 | CAR | -35.8% | 31 | -31.6% | 31 | 1-10 | -27.5% | 30 | 10.9% | 29 | 2.6% | 6 |
| 32 | NYG | -37.8% | 32 | -33.3% | 32 | 4-8 | -30.4% | 31 | 6.1% | 25 | -1.3% | 25 |


