


NBA Postseason Best Bets (5/17)

Alex Christenson


A week of upsets and near-upsets are probably shaking up power rankings all over the Internet. Over here with DVOA ratings, we don’t have as much of a shakeup. First of all, Week 6 represented just one week out of six, and DVOA stays away from recency bias. Second, the San Francisco 49ers were so far ahead of the rest of the league that a loss to Cleveland can’t drag them out of the No. 1 spot.
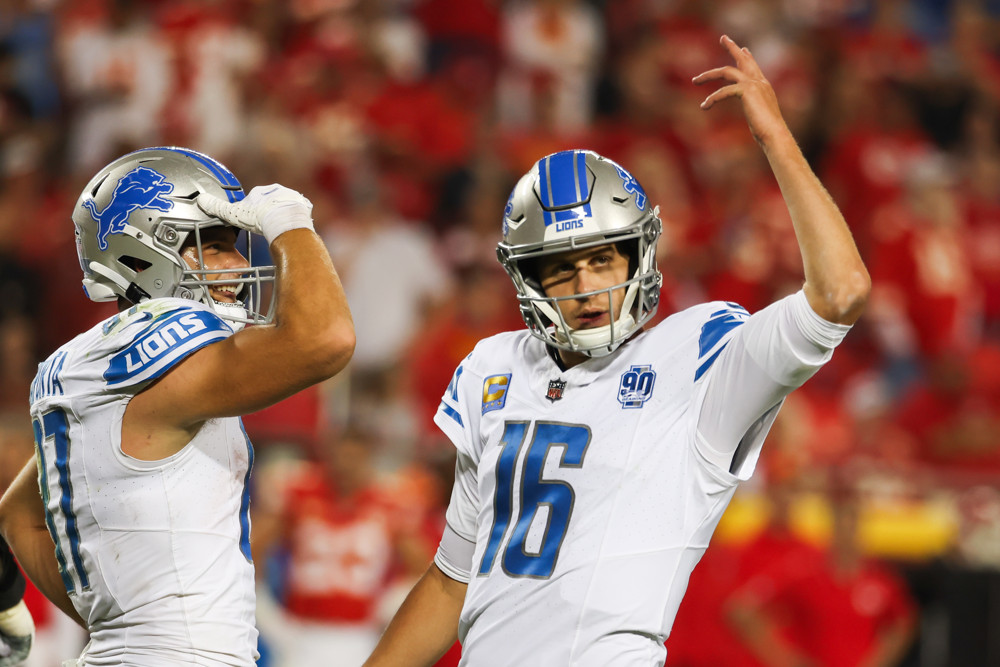
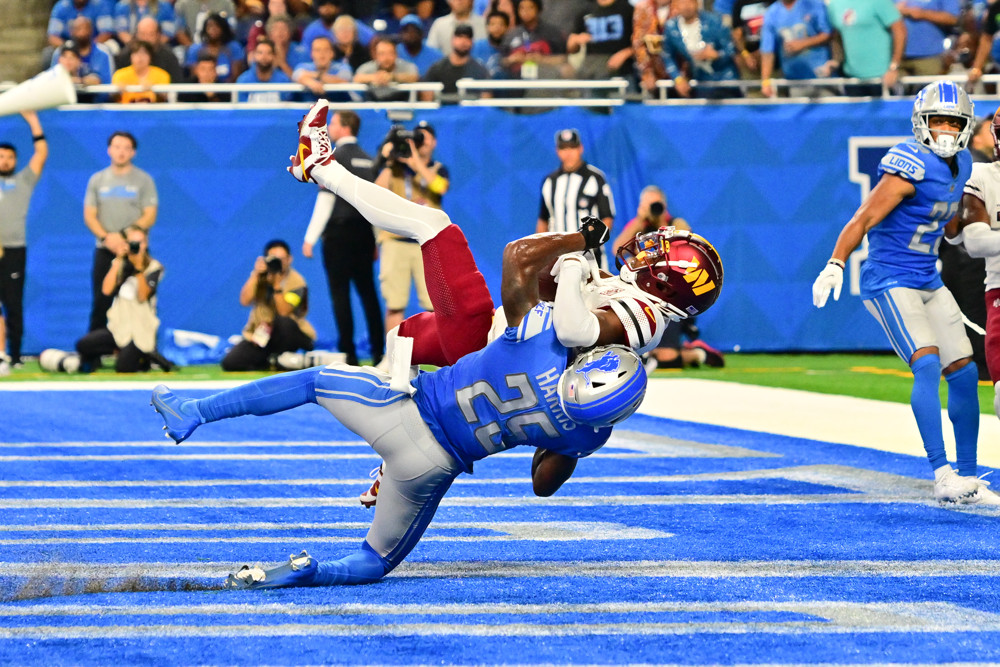
The most interesting move might be a move of just one spot, as the Detroit Lions pass the Buffalo Bills and move into second place. This is the highest the Detroit Lions have ever been in DVOA. Using the current formula, the Lions were only No. 2 one other time, after a single week of the 2014 season. Their previous high after September was 1981, when went 8-8 but finished the season fourth overall.
The Lions are a very well-balanced team so far this season. On offense, they rank fourth passing and seventh running. On defense, they are fifth against the pass and third against the run. The only problem has been special teams, where the Lions rank 19th.
Buffalo’s near-loss to the Giants drops them to third place. This was clearly a worse performance by DVOA than the Bills’ two actual losses. Miami stays at No. 4. Kansas City and Baltimore each climb a spot with Philadelphia dropping two places after losing to the Jets. Jacksonville then climbs three spots to No. 8 after a comfortable victory over Indianapolis.
The biggest riser of the week is the Los Angeles Rams. Their 26-9 win over Arizona moves them up from 18th to 12th. The Rams now rank in the top 5 on offense; not bad considering that before the season there were so many question marks on their offensive line and most people had never heard of Puka Nacua.
One of the results of Upset Week is that we don’t get to run as many of those fun tables tracking how teams and units are doing compared to history. For the most part, the teams I’ve been writing about in recent weeks are no longer as historically impressive. The Cleveland Browns defense had a great game against San Francisco but still hasn’t reached the historical top 10 either.
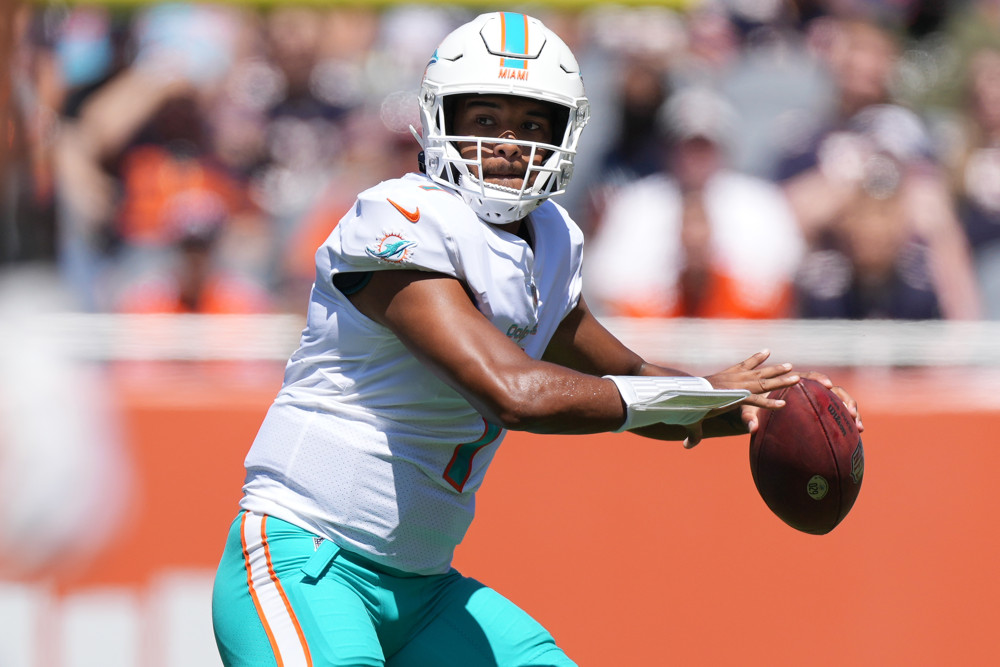
There are two units we still get to track, however. First of all, the Miami Dolphins offense is still historically powerful. It’s fun to note that the Dolphins and Browns are opposites right now. The Dolphins are first on offense and 27th on defense. The Browns are 27th on offense but first on defense. It’s better to be first on offense, though.
| Best Offensive DVOA Thru 6 Games, 1981-2023 | |||
| Year | Team | W-L | DVOA |
| 2000 | STL* | 6-0 | 45.0% |
| 1999 | WAS* | 4-2 | 41.3% |
| 2023 | MIA | 5-1 | 40.4% |
| 2013 | DEN | 6-0 | 39.9% |
| 2002 | KC | 3-3 | 39.0% |
| 1998 | DEN | 6-0 | 38.1% |
| 2007 | NE | 6-0 | 38.1% |
| 1995 | DAL | 5-1 | 35.9% |
| 2018 | LAR | 6-0 | 34.5% |
| 2004 | IND* | 4-2 | 33.9% |
| 1992 | SF | 5-1 | 33.9% |
| 2005 | SD | 3-3 | 33.8% |
Asterisks are teams which had already had a bye week, so numbers represent Week 7 instead of Week 6.
The Denver Broncos are no longer the worst defense we’ve ever tracked, but they’re still down there, even after a relatively OK 5.5% defensive DVOA against Kansas City on Thursday night. The 1998 Bengals lost to the Titans 44-14 in their sixth game, so they pass the Broncos as the worst defense ever through six games. That team started three rookies on defense, including linebackers Takeo Spikes and Brian Simmons. The other name you may have heard of from that team was nose tackle Kimo von Oelhoffen.
| Worst Defensive DVOA Thru 6 Games, 1981-2023 | |||
| Year | Team | W-L | DVOA |
| 1998 | CIN* | 2-4 | 35.1% |
| 2023 | DEN | 1-5 | 30.4% |
| 1992 | PHX* | 1-5 | 30.0% |
| 2019 | MIA* | 0-6 | 28.5% |
| 1992 | ATL | 2-4 | 27.9% |
| 1992 | NE* | 0-6 | 27.2% |
| 2002 | KC | 3-3 | 26.7% |
| 1993 | NE* | 1-5 | 26.3% |
| 2016 | DET | 3-3 | 26.0% |
| 1997 | CIN* | 1-5 | 26.0% |
| 2002 | BUF | 3-3 | 26.0% |
| 1989 | GB | 3-3 | 25.9% |
The Cincinnati Bengals did not run the ball much on Sunday against the Seattle Seahawks. Joe Burrow dropped back to pass 39 times, including three sacks and a scramble. He handed the ball to a running back only 13 times. Even when they had a small lead for the entire second half, the Bengals only had seven running plays. They avoided the ground game because Seattle has been a pass funnel this season, and Joe Mixon had just 12 carries for only 38 yards.
Let’s look at the defenses with the biggest gaps between their rank against the pass and against the run, in both directions. Teams that are better on pass defense are generally known as “run funnels” and teams that are better on run defense are known as “pass funnels,” terminology that comes from fantasy analyst Adam Levitan.
Strangely enough, opponents don’t seem to be funnelling plays towards the pass against the other major pass funnel of this season, the Tennessee Titans. Obviously, there was that strange Week 5 game where Zack Moss went HAM against the usually impenetrable Titans front, but in the other five games this year, the Titans are allowing 3.16 yards per carry. And yet, three different teams have run the ball 30 or more times against the Titans: Cleveland in Week 3, Indianapolis, and then Baltimore on Sunday morning. By comparison, the Seahawks haven’t faced 30 carries in a game since Week 1 against the Rams. Obviously, game script has a lot to do with this, and the Seahawks have a winning record, but as I said, the Bengals were leading them for the entire second half and didn’t run much.
Another pass funnel this year is the Atlanta Falcons. The Falcons faced 30 carries in Week 1 and haven’t faced more than 27 carries in a game since. Washington had 19 carries against them this week. (All these numbers are considering scrambles as pass plays, not runs, and leaving out kneeldowns.)
Here’s a list of the top five pass funnels of the 2023 season, as of Week 6:
| 2023 Pass Funnels as of Week 6 | |||||
| Team | Pass Def | Rk | Run Def | Rk | Dif |
| SEA | 14.5% | 24 | -28.7% | 1 | 23 |
| TEN | 21.8% | 28 | -22.8% | 5 | 23 |
| ATL | 25.5% | 29 | -19.4% | 9 | 20 |
| PHI | 11.1% | 20 | -28.6% | 2 | 18 |
| NE | 13.7% | 23 | -19.5% | 8 | 15 |
Flip it around, and you get run funnels. The top run funnels are so strong that it actually is more efficient to run against them than to pass the ball, even though passing is almost always more efficient than running. That’s rare. Sometimes you’ll get a team where the ranks are very different but the actual defensive DVOA is the same for passing and running, such as the Cincinnati Bengals. With the Carolina Panthers defense, however, it definitely makes sense to run against them instead of passing the ball. That’s before you consider that you’re probably ahead of the Panthers on the scoreboard. On the other hand, you may not get much opportunity to run in the second half against the top two run funnels, even if they are better defenses against the pass than the run:
| 2023 Run Funnels as of Week 6 | |||||
| Team | Pass Def | Rk | Run Def | Rk | Dif |
| SF | -18.9% | 2 | -4.3% | 22 | 20 |
| KC | -10.9% | 6 | -8.1% | 21 | 15 |
| CIN | 3.8% | 13 | 2.9% | 28 | 15 |
| CAR | 8.9% | 18 | 22.2% | 32 | 13 |
| GB | 6.2% | 14 | 1.8% | 26 | 12 |
* * * * *
These are the FTN DVOA and DAVE ratings through six weeks of 2023. Our Defense-adjusted Value Over Average (DVOA) system breaks down every single play and compares a team’s performance to the league average based on situation in order to determine value over average. (Explained further here.) Opponent adjustments are currently at 60% strength.
OFFENSE and DEFENSE DVOA are adjusted for performance indoors and consider all fumbles, kept or lost, as equal value. SPECIAL TEAMS DVOA is adjusted for type of stadium (warm, cold, dome, Denver) and week of season. As always, positive numbers represent more points so DEFENSE is better when it is NEGATIVE.
DAVE is a formula which combines our preseason forecast with current DVOA to get a more accurate projection of how a team will play the rest of the season. DAVE is currently 55% preseason forecast and 45% actual performance for teams with six games and 65% forecast with 35% actual performance for teams with five games.
| RK | TEAM | TOTAL DVOA |
LAST WEEK |
TOTAL DAVE |
RANK | W-L | OFF. DVOA |
OFF. RANK |
DEF. DVOA |
DEF. RANK |
S.T. DVOA |
S.T. RANK |
| 1 | SF | 44.6% | 1 | 27.5% | 1 | 5-1 | 30.8% | 2 | -14.0% | 5 | -0.1% | 20 |
| 2 | DET | 38.8% | 3 | 21.1% | 4 | 5-1 | 22.4% | 4 | -16.5% | 3 | -0.1% | 19 |
| 3 | BUF | 38.0% | 2 | 25.3% | 2 | 4-2 | 27.3% | 3 | -11.2% | 6 | -0.6% | 21 |
| 4 | MIA | 28.2% | 4 | 15.5% | 6 | 5-1 | 40.3% | 1 | 7.8% | 27 | -4.4% | 30 |
| 5 | KC | 27.9% | 6 | 21.3% | 3 | 5-1 | 15.1% | 6 | -9.9% | 9 | 2.9% | 4 |
| 6 | BAL | 25.2% | 7 | 16.0% | 5 | 4-2 | 8.1% | 10 | -16.6% | 2 | 0.5% | 15 |
| 7 | PHI | 17.8% | 5 | 14.4% | 7 | 5-1 | 12.9% | 7 | -1.6% | 13 | 3.2% | 3 |
| 8 | JAX | 14.6% | 11 | 7.8% | 9 | 4-2 | 2.2% | 13 | -10.3% | 8 | 2.1% | 7 |
| 9 | CLE | 13.6% | 9 | 6.9% | 10 | 3-2 | -15.7% | 27 | -29.3% | 1 | 0.0% | 18 |
| 10 | SEA | 12.8% | 8 | 4.5% | 12 | 3-2 | 9.5% | 9 | -1.4% | 16 | 1.8% | 9 |
| 11 | DAL | 9.2% | 12 | 11.6% | 8 | 4-2 | -5.5% | 18 | -14.3% | 4 | 0.4% | 16 |
| 12 | LAR | 9.0% | 18 | -1.3% | 16 | 3-3 | 15.5% | 5 | 1.6% | 18 | -4.9% | 31 |
| 13 | NO | 6.8% | 10 | 4.1% | 13 | 3-3 | -6.2% | 20 | -11.0% | 7 | 2.0% | 8 |
| 14 | LAC | 2.8% | 13 | 6.4% | 11 | 2-3 | 12.7% | 8 | 6.9% | 26 | -3.1% | 27 |
| 15 | TB | -0.1% | 14 | -6.0% | 20 | 3-2 | -5.7% | 19 | -8.7% | 10 | -3.2% | 28 |
| 16 | MIN | -0.6% | 17 | -5.4% | 19 | 2-4 | -1.2% | 15 | -1.4% | 15 | -0.8% | 23 |
| RK | TEAM | TOTAL DVOA |
LAST WEEK |
TOTAL DAVE |
RANK | W-L | OFF. DVOA |
OFF. RANK |
DEF. DVOA |
DEF. RANK |
S.T. DVOA |
S.T. RANK |
| 17 | HOU | -0.6% | 16 | -10.7% | 27 | 3-3 | 3.4% | 11 | 6.8% | 25 | 2.7% | 5 |
| 18 | IND | -1.2% | 15 | -8.8% | 23 | 3-3 | -0.4% | 14 | 0.2% | 17 | -0.7% | 22 |
| 19 | NYJ | -5.8% | 23 | -4.1% | 18 | 3-3 | -15.3% | 26 | -3.2% | 12 | 6.3% | 1 |
| 20 | PIT | -8.6% | 20 | 1.3% | 14 | 3-2 | -16.7% | 28 | -7.5% | 11 | 0.6% | 14 |
| 21 | GB | -8.6% | 19 | -2.2% | 17 | 2-3 | -2.0% | 16 | 4.1% | 21 | -2.5% | 26 |
| 22 | CIN | -9.8% | 24 | 0.6% | 15 | 3-3 | -8.9% | 23 | 3.4% | 20 | 2.5% | 6 |
| 23 | TEN | -10.3% | 22 | -9.3% | 25 | 2-4 | -8.5% | 22 | 2.0% | 19 | 0.2% | 17 |
| 24 | WAS | -14.3% | 26 | -6.9% | 21 | 3-3 | -7.4% | 21 | 5.5% | 22 | -1.5% | 25 |
| 25 | ARI | -17.4% | 21 | -19.8% | 29 | 1-5 | 2.9% | 12 | 21.1% | 31 | 0.8% | 12 |
| 26 | ATL | -20.0% | 25 | -7.6% | 22 | 3-3 | -10.9% | 24 | 5.6% | 24 | -3.5% | 29 |
| 27 | LV | -22.4% | 28 | -9.1% | 24 | 3-3 | -18.4% | 30 | 5.5% | 23 | 1.5% | 11 |
| 28 | NE | -22.5% | 27 | -10.5% | 26 | 1-5 | -16.7% | 29 | -1.6% | 14 | -7.4% | 32 |
| 29 | CHI | -26.5% | 29 | -20.4% | 30 | 1-5 | -12.8% | 25 | 15.4% | 29 | 1.6% | 10 |
| 30 | DEN | -31.4% | 30 | -15.4% | 28 | 1-5 | -4.6% | 17 | 30.4% | 32 | 3.5% | 2 |
| 31 | CAR | -34.5% | 31 | -22.8% | 32 | 0-6 | -19.6% | 31 | 15.6% | 30 | 0.6% | 13 |
| 32 | NYG | -44.1% | 32 | -22.7% | 31 | 1-5 | -32.2% | 32 | 10.9% | 28 | -1.0% | 24 |