Best MLB Bets Today – Free (Friday 5/3)

Adam Strangis


The Miami Dolphins offense is a steamroller. You will not be surprised to learn that the Dolphins now have the best offensive DVOA we’ve ever measured through three games. But you might be surprised by:
Let’s take these items in reverse order!
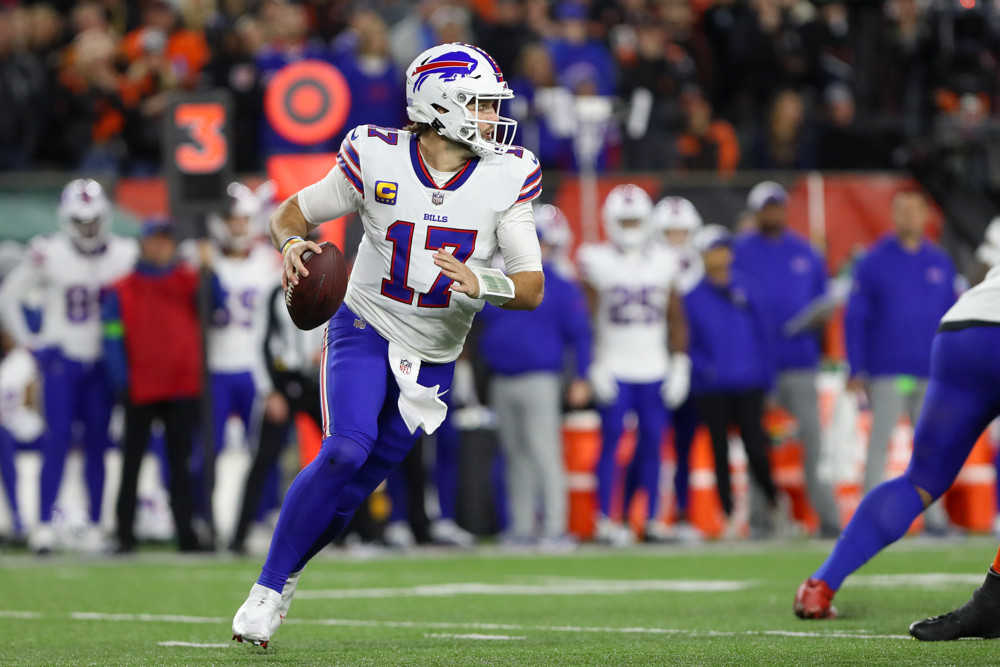
Buffalo is the top team in DVOA so far because the Bills have been more all-around dominant than the Dolphins have. Even this week, the Bills (89.2%) ended up with a higher single-game total DVOA than the Dolphins (82.7%) because of their defensive performance. So far, the Bills are fifth on offense and second on defense. Miami, on the other hand, has a record-setting offense but is 21st on defense and dead last on special teams. However, I should note that we’re still not including opponent adjustments in DVOA and those don’t get introduced until next week. The Bills have played the easiest schedule so far by average DVOA of opponent, while the Miami schedule ranks 22nd — easier than average, but not as easy as Buffalo’s.
The Bills and Dolphins being 1-2 in DVOA sets up Sunday’s game as a rare “DVOA Bowl” where the top two teams face off against each other for DVOA supremacy. The last DVOA Bowl featured the 2018 Chiefs and 2018 Rams in the infamous 54-51 Monday night game that is sometimes considered the greatest regular-season game in NFL history. Let’s hope Sunday’s Bills-Dolphins contest is that good! (Edit: it turns out that with the new version of DVOA, there has been a more recent DVOA Bowl, the 2020 Week 15 game between Kansas City and New Orleans. No. 1 Kansas City won that game 32-29.)
Next, you may be wondering about the Dolphins and how a 70-burger did not come out as one of the best single-game offensive performances in DVOA history. As of right now, the Dolphins have 84.5% offensive DVOA for Sunday’s game, although that will change during the year based on both opponent adjustments and the normalization variables which keep the entire season averaging 0.0%. Even if we remove opponent adjustments, there have been 13 different offensive performances since 1981 that made it over 90% VOA. Miami’s game on Sunday ranks 20th.
I’m guessing there are two reasons why Miami’s game didn’t quite make it into the top 10. First of all, short fields. Miami got one touchdown on a drive that started at the Denver 3 and then another touchdown on a drive that started at the Denver 8. Second, the changes in the new version of DVOA that down-weighted blowouts in order to make DVOA more predictive but less descriptive. Three of Miami’s touchdowns came in the fourth quarter when they already had a huge lead. Those plays don’t matter as much in the new version of DVOA.
Miami may not have cracked the all-time top 10 for single offensive games, but like I said, their offense has been a steamroller all season. And so, the Dolphins have the best offense we’ve ever measure through three games — by a huge margin. The new version of DVOA, in part because it down-weights blowouts, has moved the numbers at both extremes a little bit closer to average. Only four offenses other offenses in history now top 50% through three games. And the Dolphins are at 62.3%, completely blowing that out of the water. Look at this crazy gap!
| Best Offensive DVOA Through 3 Games, 1981-2023 | |||||
| Year | Team | W-L | DVOA | Final DVOA |
Final Rk |
| 2023 | MIA | 3-0 | 62.3% | — | — |
| 1999 | WAS | 2-1 | 51.8% | 20.7% | 1 |
| 1998 | DEN | 3-0 | 51.4% | 32.1% | 1 |
| 2019 | DAL | 3-0 | 51.2% | 21.2% | 3 |
| 1991 | BUF | 3-0 | 50.9% | 21.3% | 3 |
| 2018 | KC | 3-0 | 48.5% | 33.1% | 1 |
| 1998 | SF* | 3-0 | 48.0% | 26.5% | 2 |
| 2005 | PIT | 2-1 | 44.2% | 9.1% | 9 |
| 2010 | NE | 2-1 | 43.8% | 38.2% | 1 |
| 2007 | NE | 3-0 | 43.4% | 37.6% | 1 |
| 1992 | DAL | 3-0 | 43.2% | 23.4% | 2 |
| 2017 | KC | 3-0 | 43.0% | 17.2% | 3 |
The asterisk on San Francisco is because the 1998 49ers had their bye week in Week 3 and therefore that number represents Week 4 DVOA. And yes, Washington was No. 1 on offense in 1999, not the Greatest Show on Turf. The Rams don’t rank as high in offensive DVOA that year because of great field position from a top defense, a massively easy schedule, and the adjustment for offenses playing indoors.
Buffalo and Miami are followed up by San Francisco at No. 3, Cleveland at No. 4, and the final undefeated team, Philadelphia, at No. 5. Kansas City is sixth and the Dallas Cowboys are now seventh, falling from No. 1 a week ago. That loss to Arizona was bad, and it was good for the Cardinals. How good? This seems crazy, but the Cardinals moved into the top 10 in DVOA this week! Remember, this is only based on the three games they’ve played this season, with no opponent adjustments yet. It has nothing to do with how good we thought the Cardinals were in the preseason. Arizona is still 27th in DAVE, which incorporates that data. But is it possible that the Arizona Cardinals, as I wrote last week, do not completely suck?
The loss to Arizona also took the Cowboys out of the top spot on defense. A week ago, the Cowboys were ranked among the best defenses we had ever tracked early in the season. Now, it’s a different defense that gets that accolade: the Cleveland Browns. Cleveland has allowed just 3.2 yards per play this season and now ranks as the No. 7 best defense tracked by DVOA through three games.
| Best Defensive DVOA Through 3 Games, 1981-2023 | |||||
| Year | Team | W-L | DVOA | Final DVOA |
Final Rk |
| 2019 | NE | 3-0 | -70.2% | -21.1% | 1 |
| 1991 | PHI | 2-1 | -60.9% | -38.0% | 1 |
| 1984 | CHI | 3-0 | -58.8% | -25.8% | 1 |
| 2002 | SD | 3-0 | -51.0% | 3.8% | 22 |
| 1997 | SF | 2-1 | -49.0% | -20.8% | 1 |
| 1999 | TB | 2-1 | -48.6% | -18.9% | 2 |
| 2023 | CLE | 2-1 | -48.2% | — | — |
| 1996 | GB | 3-0 | -47.6% | -21.1% | 1 |
| 2008 | BAL* | 2-1 | -46.6% | -27.7% | 1 |
| 2021 | CAR | 3-0 | -46.2% | 0.6% | 18 |
| 2006 | SD* | 2-1 | -44.7% | -2.7% | 13 |
| 2006 | BAL | 3-0 | -44.1% | -21.5% | 1 |
As you can see, a lot of these defenses stayed on top of the league all year long, but defenses that start super hot are more likely to fade than offenses that start super hot. That’s because offense is, in general, more consistent and predictive than defense.
The flip side of Cleveland — and of Miami, because somebody had to give up those 70 points — is the Denver Broncos. The Broncos didn’t have a good defensive start, ranking 30th after two weeks, but then they gave up the 70-burger to Miami. And therefore, the Broncos now rank as the No. 4 worst defense ever tracked by DVOA through three games.
| Worst Defensive DVOA Through 3 Games, 1981-2023 | |||||
| Year | Team | W-L | DVOA | Final DVOA |
Final Rk |
| 2006 | HOU | 0-3 | 45.8% | 9.6% | 28 |
| 2008 | DET | 0-3 | 43.0% | 22.3% | 32 |
| 2002 | KC | 1-2 | 40.4% | 17.0% | 31 |
| 2023 | DEN | 0-3 | 39.8% | — | — |
| 2001 | ARI* | 1-2 | 37.7% | 18.7% | 31 |
| 2013 | WAS | 0-3 | 37.2% | 5.2% | 20 |
| 2008 | STL | 0-3 | 36.9% | 12.2% | 27 |
| 1990 | SEA | 0-3 | 35.9% | -7.9% | 8 |
| 2009 | TB | 0-3 | 34.9% | 8.9% | 25 |
| 2021 | KC | 1-2 | 33.6% | 2.4% | 22 |
| 2019 | NYG | 1-2 | 33.0% | 12.6% | 29 |
| 1999 | NYJ | 0-3 | 32.1% | -0.8% | 16 |
How about that turnaround from the 1990 Seahawks? That team allowed at least 320 yards in each of its first three games, then didn’t allow 320 yards again until a Week 15 loss to Dan Marino and the Miami Dolphins.
Finally, a look at a couple of surprising ranks in the table below. You may notice that Green Bay drops from sixth to 12th while New Orleans only drops two spots from ninth to 11th. That’s because the Saints had the higher DVOA in Sunday’s Green Bay win, with 9.8% compared to -10.0% for the Packers. The Packers had only a 28% Post-Game Win Expectancy (explained here). The other “reverse PGWE” game this week was the Colts’ win over the Baltimore Ravens. The Colts won with a 26% PGWE, and Baltimore had 14.8% DVOA in the loss. So the Ravens drop just one spot to eighth, while the Colts stay at 15th. That’s still higher than we would have expected before the season, primarily because the Colts had 55.8% DVOA in their Week 2, 31-20 win over the Houston Texans.
* * * * *
These are the FTN DVOA and DAVE ratings through three weeks of 2023. Our Defense-adjusted Value Over Average (DVOA) system breaks down every single play and compares a team’s performance to the league average based on situation in order to determine value over average. (Explained further here.) Please note that there are no opponent adjustments in DVOA until after Week 4.
OFFENSE and DEFENSE DVOA are adjusted for performance indoors and consider all fumbles, kept or lost, as equal value. SPECIAL TEAMS DVOA is adjusted for type of stadium (warm, cold, dome, Denver) and week of season. As always, positive numbers represent more points so DEFENSE is better when it is NEGATIVE.
DAVE is a formula which combines our preseason forecast with current DVOA to get a more accurate projection of how a team will play the rest of the season. DAVE is currently 78% preseason forecast and 22% actual performance. DAVE ratings for the Dallas Cowboys have been adjusted for the injury to Trevon Diggs.
| RK | TEAM | TOTAL DVOA |
LAST WEEK |
TOTAL DAVE |
RANK | W-L | OFF. DVOA |
OFF. RANK |
DEF. DVOA |
DEF. RANK |
S.T. DVOA |
S.T. RANK |
| 1 | BUF | 55.5% | 3 | 24.9% | 1 | 2-1 | 18.0% | 5 | -37.4% | 2 | 0.0% | 19 |
| 2 | MIA | 50.1% | 4 | 14.9% | 6 | 3-0 | 62.3% | 1 | 2.9% | 21 | -9.3% | 32 |
| 3 | SF | 48.7% | 2 | 21.3% | 2 | 3-0 | 24.9% | 2 | -20.4% | 4 | 3.4% | 7 |
| 4 | CLE | 42.3% | 5 | 12.0% | 7 | 2-1 | -5.6% | 18 | -48.2% | 1 | -0.3% | 20 |
| 5 | PHI | 31.9% | 10 | 15.9% | 5 | 3-0 | 12.9% | 10 | -14.3% | 7 | 4.6% | 4 |
| 6 | KC | 30.4% | 13 | 18.9% | 3 | 2-1 | 16.3% | 6 | -10.9% | 9 | 3.2% | 9 |
| 7 | DAL | 28.5% | 1 | 17.3% | 4 | 2-1 | 2.7% | 15 | -24.8% | 3 | 1.0% | 16 |
| 8 | BAL | 22.9% | 7 | 11.7% | 8 | 2-1 | 12.9% | 11 | -16.5% | 5 | -6.5% | 29 |
| 9 | DET | 21.2% | 17 | 9.7% | 9 | 2-1 | 15.5% | 7 | -5.5% | 12 | 0.2% | 18 |
| 10 | ARI | 18.4% | 18 | -13.0% | 27 | 1-2 | 14.9% | 8 | 0.3% | 16 | 3.7% | 6 |
| 11 | NO | 15.2% | 9 | 4.8% | 11 | 2-1 | -4.5% | 17 | -16.4% | 6 | 3.3% | 8 |
| 12 | GB | 15.0% | 6 | 4.5% | 12 | 2-1 | 13.7% | 9 | -5.9% | 10 | -4.5% | 27 |
| 13 | SEA | 8.8% | 20 | 1.8% | 16 | 2-1 | 18.5% | 4 | 9.4% | 23 | -0.4% | 21 |
| 14 | NE | 3.7% | 24 | 2.2% | 15 | 1-2 | 5.1% | 13 | -5.5% | 11 | -6.9% | 31 |
| 15 | IND | 0.1% | 15 | -12.0% | 26 | 2-1 | -8.2% | 21 | -5.1% | 13 | 3.2% | 10 |
| 16 | LAC | 0.0% | 22 | 6.4% | 10 | 1-2 | 24.5% | 3 | 21.5% | 29 | -2.9% | 23 |
| RK | TEAM | TOTAL DVOA |
LAST WEEK |
TOTAL DAVE |
RANK | W-L | OFF. DVOA |
OFF. RANK |
DEF. DVOA |
DEF. RANK |
S.T. DVOA |
S.T. RANK |
| 17 | PIT | -6.4% | 28 | 3.6% | 13 | 2-1 | -21.6% | 27 | -13.0% | 8 | 2.2% | 13 |
| 18 | LAR | -7.0% | 19 | -9.0% | 23 | 1-2 | 8.8% | 12 | 11.9% | 26 | -3.9% | 25 |
| 19 | TB | -8.8% | 8 | -9.2% | 24 | 2-1 | -9.2% | 22 | -3.7% | 14 | -3.3% | 24 |
| 20 | MIN | -9.5% | 16 | -9.4% | 25 | 0-3 | 2.5% | 16 | 13.1% | 27 | 1.1% | 15 |
| 21 | HOU | -11.6% | 30 | -17.5% | 31 | 1-2 | -7.1% | 20 | 10.1% | 25 | 5.6% | 3 |
| 22 | WAS | -14.9% | 11 | -3.7% | 19 | 2-1 | -7.0% | 19 | 2.2% | 19 | -5.7% | 28 |
| 23 | CIN | -18.1% | 29 | 2.6% | 14 | 1-2 | -17.1% | 25 | 6.9% | 22 | 5.9% | 2 |
| 24 | JAX | -18.3% | 12 | -1.8% | 17 | 1-2 | -10.0% | 23 | 1.7% | 18 | -6.6% | 30 |
| 25 | ATL | -23.1% | 14 | -2.7% | 18 | 2-1 | -16.3% | 24 | 2.7% | 20 | -4.1% | 26 |
| 26 | CAR | -27.2% | 23 | -16.3% | 30 | 0-3 | -20.2% | 26 | 9.8% | 24 | 2.9% | 11 |
| 27 | TEN | -28.2% | 25 | -13.1% | 28 | 1-2 | -30.6% | 30 | -1.1% | 15 | 1.2% | 14 |
| 28 | NYJ | -28.5% | 26 | -8.0% | 21 | 1-2 | -39.3% | 32 | 0.7% | 17 | 11.4% | 1 |
| 29 | DEN | -31.1% | 21 | -8.4% | 22 | 0-3 | 4.4% | 14 | 39.8% | 32 | 4.4% | 5 |
| 30 | LV | -39.0% | 27 | -7.2% | 20 | 1-2 | -22.5% | 28 | 19.0% | 28 | 2.4% | 12 |
| 31 | NYG | -52.8% | 32 | -16.2% | 29 | 1-2 | -28.3% | 29 | 22.9% | 31 | -1.6% | 22 |
| 32 | CHI | -59.0% | 31 | -25.2% | 32 | 0-3 | -37.2% | 31 | 22.5% | 30 | 0.7% | 17 |