Today’s Best Bets

Sam Choudhury


In the first portion of this football analytics breakdown, I gave you the list of terms I felt was most vital for you to know if you’re looking to engage with the fantasy community about the game we all love. In part two, the focus is going to shift to the usefulness of the statistics, and how they can help you win in fantasy football.
Perhaps the single-most valuable advanced metric in fantasy football is air yards. Here is the coefficient of determination for a linear regression between air yards and fantasy points, both through the passing game only, and overall. In layman's terms, if you had only air yards at your disposal, what percentage of PPR fantasy scoring is explained?
|
Position |
Air vs. Pass/Rec FPs |
Air vs. Total FPs |
|
QB |
0.7327 |
0.6977 |
|
RB |
0.2944 |
0.116 |
|
WR |
0.842 |
0.8366 |
|
TE |
0.8956 |
0.8955 |
The power of air yards is immediately obvious. With the exception of RBs, who tend to receive most of their touches as rushes, every position sees at least 69% of their total fantasy production explained by air yards, with as high as about 90% of TE production being explained by only air yards.
If air yards are the most important fantasy statistic, then we should be attempting to predict them as best as possible. That would require focusing on the two components of air yards: aDOT and targets/pass attempts.
One of the bigger debates in both the fantasy and real-life football communities is about just how much receiver play impacts quarterback play, and vice versa. Since air yards are so valuable to fantasy production, it makes sense to take a look at what drives air yards the most.
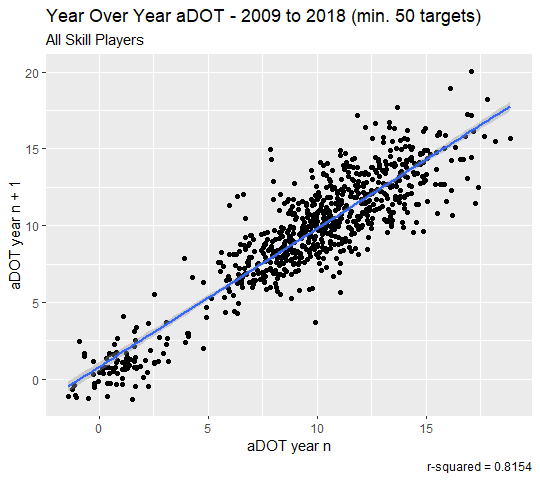
Average depth of target is a major component of air yards, and as you can see, it appears to be mostly driven by the receiver, not the QB:
While there is limited year-over-year stability in QB aDOT, we can see that the statistic is remarkably sticky for skill players (RBs, WRs, TEs). It is reasonable to conclude that depth of target belongs to the receiver.
Each player has a unique set of skills, and coaches seem to be good at identifying those skills, and how to use them on the football field. This drives the bus for pass game design and, for fantasy, sets the table for the whole offense. A QB’s aDOT is really just the sum of the parts he has to work with.
Depth of target belongs to the receiver, but he still needs targets in order to accumulate air yards. Fortunately for us, there is again evidence that targets are a skill-based statistic.
I took a look at every QB, WR and TE since 2000 to play in at least six games in consecutive years. Pass attempts per game for QBs had a year-over-year r-squared of 0.337, while that number was 0.5605 for WR and TE targets per game. Right away we can see that team volume appears to be based more on who is receiving the ball than who is delivering it.
This is especially true for our high-usage players. There have been 421 WRs and TEs since 2000 to see eight or more targets per game (minimum six games), and appear in at least six games the following season. 267 of them (63%) hit the eight target/game mark again. So not only are targets per game sticky year to year, it also appears that the high-volume players are also very likely to continue to see high volume. This makes it likely that receiving targets is a skill.
As a result, weighted opportunity rating (WOPR) can tell us a ton about receiver performance, which brings this full-circle with air yards. It takes the percentage of team air yards and team targets and blends it together for one metric. The year-over-year stability is even greater for WOPR than it is for targets per game, sitting at 0.6303 from 2009 to 2018.
In fact, we can get a ton of signal on NEXT YEAR’s PPR scoring using WOPR alone.
All of this research so far illuminates a few points for us:
Most fantasy production is rooted in air yards
An easy way to find QB sleepers is to find those underpriced versus their weapons
QB impact is likely over-valued when looking at receivers
Volume is predictive
WOPR is the most valuable statistic for receivers
A lot of the statistics in our glossary dealt with player efficiency. Let’s take a look at the year-over-year stability of all of them. For the purposes of this, I will limit the samples to players with 50 targets/rushes or 200 pass attempts in consecutive years (passing efficiency data courtesy of Josh Hermsmeyer).
|
Metric |
YoY r-squared |
|
ANY/A |
0.149 |
|
aPACR |
0.241 |
|
PACR |
0.307 |
|
AYA |
0.145 |
|
RACR |
0.0024 |
|
YPRR |
0.1996 |
|
YPT |
.0609 |
|
YPC |
.0317 |
We have a bit of the opposite scenario in efficiency as we did with target depth and volume. The stickier statistics are (mostly) all related to passing, with PACR being the top overall statistic in terms of year-over-year stability.
Efficiency is mostly a sham at the skill positions, but PFF’s YPRR provides us with some predictive hope in the receiving game. Of course, this is only one part of the equation. Do any of these statistics help us to explain fantasy points?
|
Metric |
R-squared to PPG |
|
ANY/A |
0.6158 |
|
aPACR |
0.2691 |
|
PACR |
0.1248 |
|
AYA |
0.5177 |
|
RACR |
-0.0002 |
|
YPRR |
0.3816 |
|
YPT |
0.0953 |
|
YPC |
0.0958 |
Unfortunately, the statistics for passing that have the most stability do not lend themselves nicely to fantasy production. Instead, it is the highly unstable ANY/A and AYA that describe fantasy production the best. These two metrics weigh TDs the most, and it is clear that they matter a great bit to scoring for fantasy passers. There is also some indication here that being able to avoid sacks, which are included in ANY/A, signal overall quality on offense, which leads to more fantasy production. aPACR is the best overall metric here, but it is not a great bet relative to the others we have looked at in this piece.
Receiving, meanwhile, continues to build upon our idea of talent shining out in the long-run for fantasy. Yards per route run blows away every other efficiency metric. Some combination of WOPR and YPRR should dominate your fantasy research for receiving options.